
Do you believe in technical analysis or market timing?
No.
The question above was number 13 in the “The 19 Questions to Ask Your Financial Adviser” that were suggested recently by Wall Street Journal columnist, Jason Zweig. The response was my answer in last week’s “Answers to…” those questions.
Admittedly, I didn’t provide much color to that particular answer. Subsequently, I received several questions as to why I so readily dismiss those popular trading tactics. Seriously? Questioning my judgement? I'll tell you what, let's grab a couple of six-shooters and step outside.
Don't worry, no one will get hurt. We'll have an old fashioned shooting match that should illustrate my point. I'll even let you pick the rules from the two choices below.
- We will put targets up on the side of barn. We’ll each take 3 shots and the one with the most bullseyes wins.
- We will each take 6 shots at the barn, then we’ll draw a circle around the tightest groupings. The one with the 3 closest shots in a circle wins.
Which approach makes sense?
While option one will probably result in the best marksman winning, the second option will likely demonstrate what is known as the Texas Sharpshooter Fallacy. This approach leads to false conclusions characterized by ignoring differences in data while stressing similarities. By discounting errant shots and only choosing the ones that yield the desired result, we might as well flip a coin to determine who is the better shot.
This is also how technical analysis, or using charts to predict future prices, frequently works. Adherents will insist that they can successfully predict how an investment or market will perform based on easily recognized patterns formed by charting the historical prices of those assets. My personal observation has been that chartists are remarkably skilled at explaining why things happened after they occur, but are no better than random chance if those predictions are made in advance.
The subjective nature of what constitutes a buy or sell chart shape has resulted in sparse academic research on the topic, but there is some. A 2003 study by economist Gerwin Griffioen concluded that: "for the U.S., Japanese and most Western European stock market indices the recursive out-of-sample forecasting procedure does not show to be profitable, after implementing little transaction costs."[i]
Another 1996 study of "momentum strategies" concluded that even small transaction costs would lead to an inability to capture any excess from such strategies.[ii]
To be fair, there is also some research that suggests there may be some value in these approaches, but keep in mind that correlations can be found in all manner of data. Random correlations, however, don’t necessarily lead to sound decision making. For example, should we do away with lawyers based on the following parellels observed by Spurious Correlations?
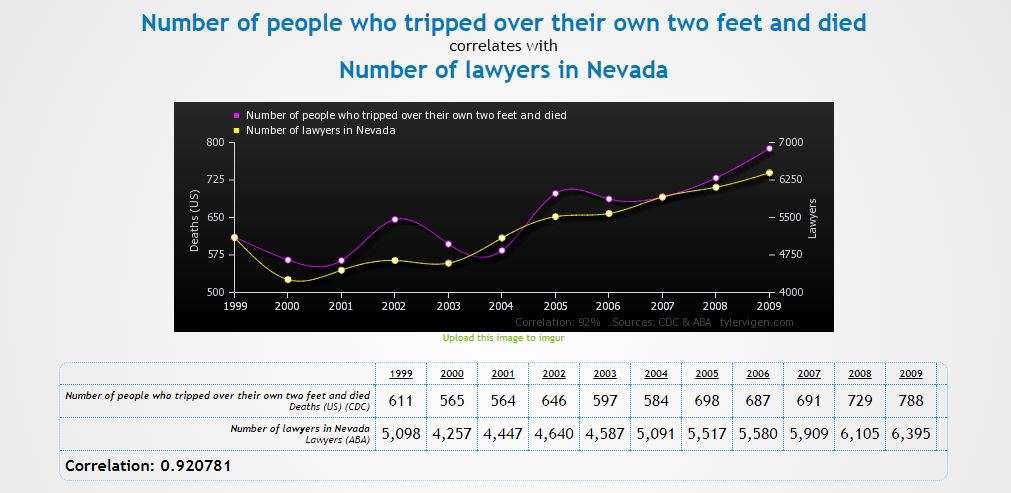
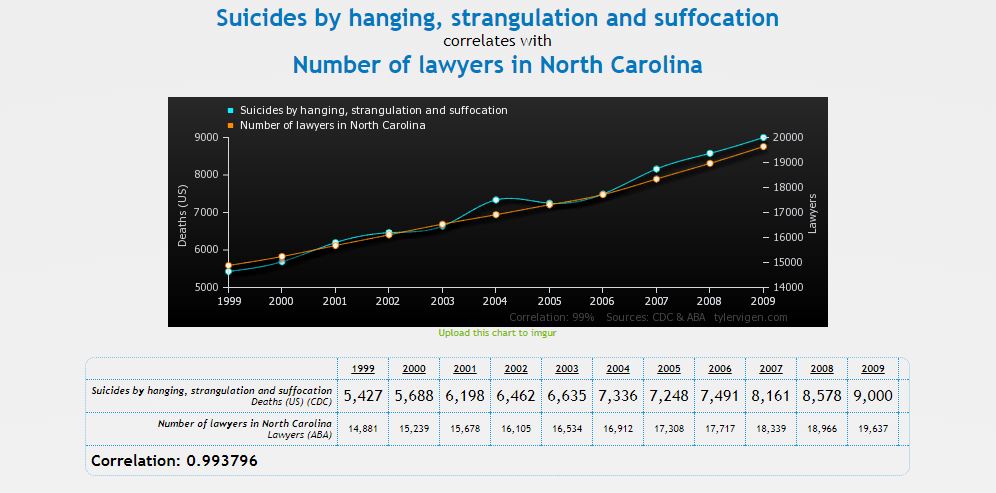
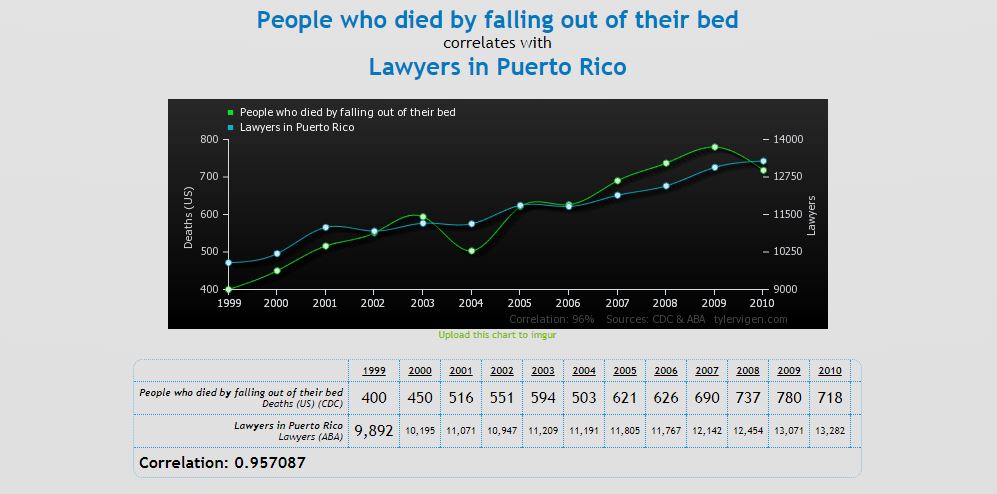
Sorry, bad question (and apologies for the low blow to my attorney friends). Hopefully, you can see that a determined artist (or "analyst") can paint just about any picture. If you would like your portfolio managed with more science and less art, get in touch.
[i] Griffioen, Technical Analysis in Financial Markets
[ii] Chan, L.K.C.; Jegadeesh, N.; Lakonishok, J. (1996). "Momentum Strategies". The Journal of Finance. The Journal of Finance, Vol. 51, No. 5. 51 (5): 1681–1713.