

Photo by Liza Summer
World stock markets have been in decline for the past 6 months or so. Not surprisingly, the lower we go, the more pessimistic we tend to be. Just this week, I have seen some analysts predicting that we are perhaps just halfway through this bear market with another 25% downside from here lasting until late in the year.
Let me just say that I have no idea what stocks will do today, next week, month, or even year. However, I can look to history to offer some guidance as to how to manage these unsettling (but, not particularly unusual) periods of volatility.
Exhibit 1. The Cost of Trying to Time the Market
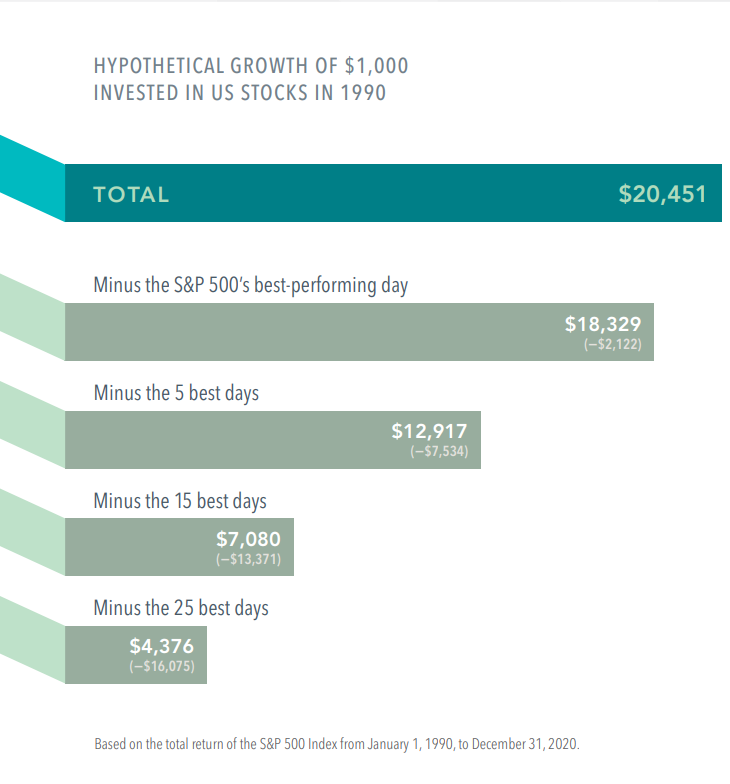
Image from Dimensional Fund Advisors. S&P data © 2021 S&P Dow Jones Indices LLC, a division of S&P Global. All rights reserved.
Corrections and bear markets typically end quite suddenly. The impact of missing just a few of the market’s best days can be profound, as Exhibit 1 shows. Staying invested and focused on the long term helps to ensure that you’re in position to capture what the market has to offer.
In fact, history suggests that investors will likely be rewarded for their discipline during downturns.
Exhibit 2. History Shows That Stock Gains Can Add Up After Big Declines

Image from Dimensional Fund Advisors. S&P data © 2021 S&P Dow Jones Indices LLC, a division of S&P Global. All rights reserved.
Historically, US stock returns following sharp downturns have, on average, been positive. A broad market index tracking data since 1926 in the US shows that stocks have tended to deliver positive returns over one-year, three-year, and five-year periods following steep declines.
Cumulative returns five years after market declines of 10%, 20%, and 30% all have topped 50%. Now we all know that past performance is no guarantee of future results. These indices are not available for direct investment. Their performance does not reflect the expenses associated with the management of an actual portfolio.
Also, returns are in US dollars and for illustrative purposes. The missed best day(s) examples assume that the hypothetical portfolio fully divested its holdings at the end of the day before the missed best day(s), held cash for the missed best day(s), and reinvested the entire portfolio in the S&P 500 Index at the end of the missed best day(s). Annualized returns for the missed best day(s) were calculated by substituting actual returns for the missed best day(s) with zero.
Finally, investing risks include loss of principal and fluctuating value. There is no guarantee an investment strategy will be successful.
Having said all of that, if you are questioning your investment plan, now may be a good time to get in touch to review it.